

Price-to-Earnings (P/E) Ratio: What is it and how is it calculated?
 Ratio: What is it?")
Summary:
What it is: The price-to-earnings (P/E) ratio measures the relationship between a share’s price and its earnings per share.
What it is used for: It helps investors determine whether a company is undervalued or overvalued relative to the market.
Quick read: A high P/E ratio may signal expectations of future growth or an expensive share; a low P/E ratio may indicate an opportunity or structural problems.
Context: It should always be compared with the sector average and other complementary financial ratios.
The price-to-earnings ratio (P/E), also known as Price Earnings Ratio (PER), is one of the financial ratios most commonly used by analysts and investors worldwide, enabling companies in the same sector to be compared on a standardised basis. It is often used in the early stages of analysis to assess the relative price of a share and to determine whether it is over- or undervalued. Find out what it is, why it’s important and how to calculate it.
Price-to-Earnings (P/E) ratio: What is it and how is it calculated?
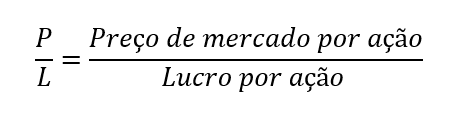
To understand the ratio, the literal meaning refers to the proportional relationship between two financial figures. The P/E ratio measures the relationship between the share price and earnings per share (EPS). The ratio is calculated by dividing the current share price by the earnings generated by the share over the last twelve months. Alternatively, the estimated profit for one of the coming years can be used, resulting in an "estimated profit”. The formula is as follows:
This ratio shows how many times the share price is higher than the earnings per share, which provides an approximate measure of the time it will take to recover the amount invested (measured in years), assuming that the free cash flow generated by the company is similar to its earnings.
Suppose a company’s current share price is 250 euros and the earnings per share are 12.50 euros. In this case, the P/E calculation would be 250/12.5, or 20 per share. This result means that investors are willing to pay 20 times the profit generated by each share of the company./p>
So if you hypothetically bought 100% of the shares in a company, it would take you 20 years to recoup your initial investment from the company’s ongoing profits. However, this 20-year estimate could change as the company grows or its profits fluctuate.
After calculating the P/E ratio, it is common to compare it with the average for the sector in which the company operates. If the company’s P/E ratio is lower than the sector average, this may indicate that the share is undervalued. On the other hand, if it’s above average, the share may be overvalued. For example, if the average P/E for the sector is 18, you could conclude that the company you are analysing is more expensive than the average of its competitors.
What is a good P/E ratio and how should it be interpreted?
There is no magic number that defines a ‘good’ P/E ratio, as the correct interpretation of this ratio and its significance depend on the sectoral context and growth prospects.
In general, the following values can be used to interpret the result of the P/E ratio:
Low P/E ratio (< 15)
The stock may be undervalued, which could present an attractive buying opportunity. On the other hand, a low P/E ratio may indicate that the company’s financial performance is deteriorating.
Moderate P/E ratio (15 – 25)
This ratio is generally considered to be healthy. In this range, a company is usually considered to be fairly valued relative to its earnings and is a reflection of a balance between growth potential and risk.
High P/E ratio (> 25)
This ratio may reflect expectations of high future growth. In other words, investors are willing to pay more for the stock now because they expect profits to rise significantly in the future. However, it can also mean that the stock is overvalued. This is a risk if growth expectations are not met.
Benefits and limitations of the P/E ratio
These are the main benefits and limitations of using this metric to help decide where to invest:
Benefits:
• Easy to calculate; just divide the price by the earnings per share.
• The P/E ratio helps to quickly assess whether the investment is viable, which makes the decision-making process easier.
• It identifies growth potential, as a high P/E ratio may indicate that the company is on a growth path, although it may also indicate overvaluation. A low P/E may indicate that the stock is undervalued or that the company is in financial difficulty.
• It allows you to compare stocks within the same sector and to identify those that are relatively cheap or expensive.
Limitations:
• This ratio is very sensitive to fluctuations in share prices, which can change rapidly due to changes in the company or the market. In practice, the P/E ratio changes on a daily basis.
• Some extraordinary items, such as asset disposals, can inflate results and thus distort the profit and loss account, so profit excluding extraordinary income should be used P/E, so profit excluding extraordinary items should therefore be used.
• Although the P/E ratio helps to assess how the market values a company’s profits, it does not, on its own, indicate whether a share is expensive or cheap. It should be analysed in conjunction with other indicators, including debt ratios such as the debt-to-equity ratio, to assess the sustainability and risk associated with growth.
• Each sector has its own pace and characteristics, which limits the use of the P/E ratio to make relevant comparisons between sectors.
Is it enough to calculate the P/E ratio to make a good decision?
It is important to emphasise that the P/E ratio is not an infallible measure and should not be used on its own. It should be considered in conjunction with other measures of financial analysis. Factors such as the company's potential to grow, its financial position and the macroeconomic environment of the sector also play an important role in valuing stocks.
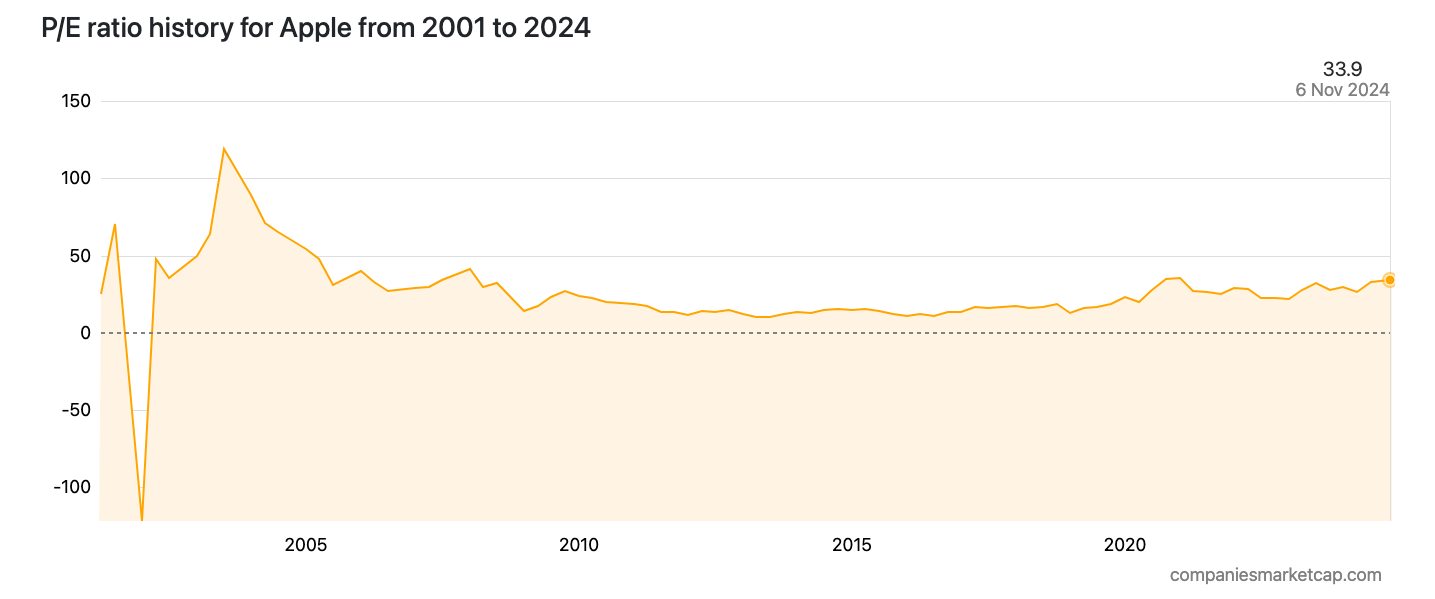
Nevertheless, the P/E ratio can be a useful tool for comparing the current valuation of a company with its historical valuation. For example, if the current P/E ratio is significantly higher than the company’s historical P/E ratio, this may indicate that the stock is more expensive than it has been in the past and may not be a good buy. Ideally, you should analyse several factors before making a decision, always with a view to achieving your financial objectives.
Alternatives to the P/E ratio
Despite the popularity of the P/E ratio, there are a number of alternatives that provide a broader perspective on the performance of a company and which can be used in addition to it:
Price/book value per share (P/B) ratio:
Compares the market value of a company to its book value. A low P/B ratio can indicate undervaluation and attract investors looking for companies with strong fundamentals.
Price-to-sales ratio (P/S):
Compares the share price to sales and is useful for companies that are not yet making significant profits or are volatile (e.g. start-ups). The P/S ratio shows how much investors are willing to pay for each euro of sales.
Enterprise Value/EBITDA Ratio (EV/EBITDA):
Valuates a company in relation to its earnings before interest, tax, depreciation and provisions. It also takes into account market capitalisation, debt and liquidity to provide a more thorough snapshot of the company.
Key Takeaways
What is the Price-to-Earnings (P/E) ratio and what is it used for?
The P/E ratio measures a stock’s price relative to its earnings per share (EPS). It’s used to assess whether a stock is overvalued or undervalued, aiding investors in making informed decisions.
How is the P/E ratio calculated?
The P/E ratio is calculated by dividing the current stock price by the earnings per share (EPS) from the past 12 months or estimated. Formula: P/E = Stock Price / EPS. Example: a $250 stock with $12.50 EPS has a P/E of 20.
What does a high or low P/E ratio mean?
A low P/E (<15) may indicate undervaluation or financial issues. A moderate P/E (15-25) suggests fair valuation. A high P/E (>25) reflects growth expectations or potential overvaluation.
What are the limitations of the P/E ratio?
Limitations include:
- Sensitivity to price fluctuations;
- Distortion by extraordinary earnings;
- Limited use for cross-sector comparisons.
It should be used with metrics like P/B or EV/EBITDA.
How can I use the P/E ratio to invest safely?
To invest safely:
- Compare the P/E to the industry average;
- Analyze the company’s history and economic context;
- Combine with other financial metrics;
- Consult experts, like those at Banco Carregosa, for personalized guidance.
Banco Carregosa, your strategic partner for investments
Find personalised advice for your financial decisions. Contact the Banco Carregosa team of experts and achieve your investment goals in a solid and informed way.